FEA: Modal Analysis
Modal analysis finds the natural frequencies and mode shapes of the supplied structure. It is a vibration-screening workflow: after assigning material and support conditions, you solve for modes, animate them, compare directions, and use the report to identify frequencies that may be close to rotor or motor excitation.

What you will learn
- Prepare geometry, material, and support conditions for a modal run.
- Understand why stiffness, mass, and constraints determine natural frequency.
- Select different modes and play their deformation animation.
- Use a color map and direction components to interpret mode shapes.
- Read the frequency table and report summary.
1. Geometry and material
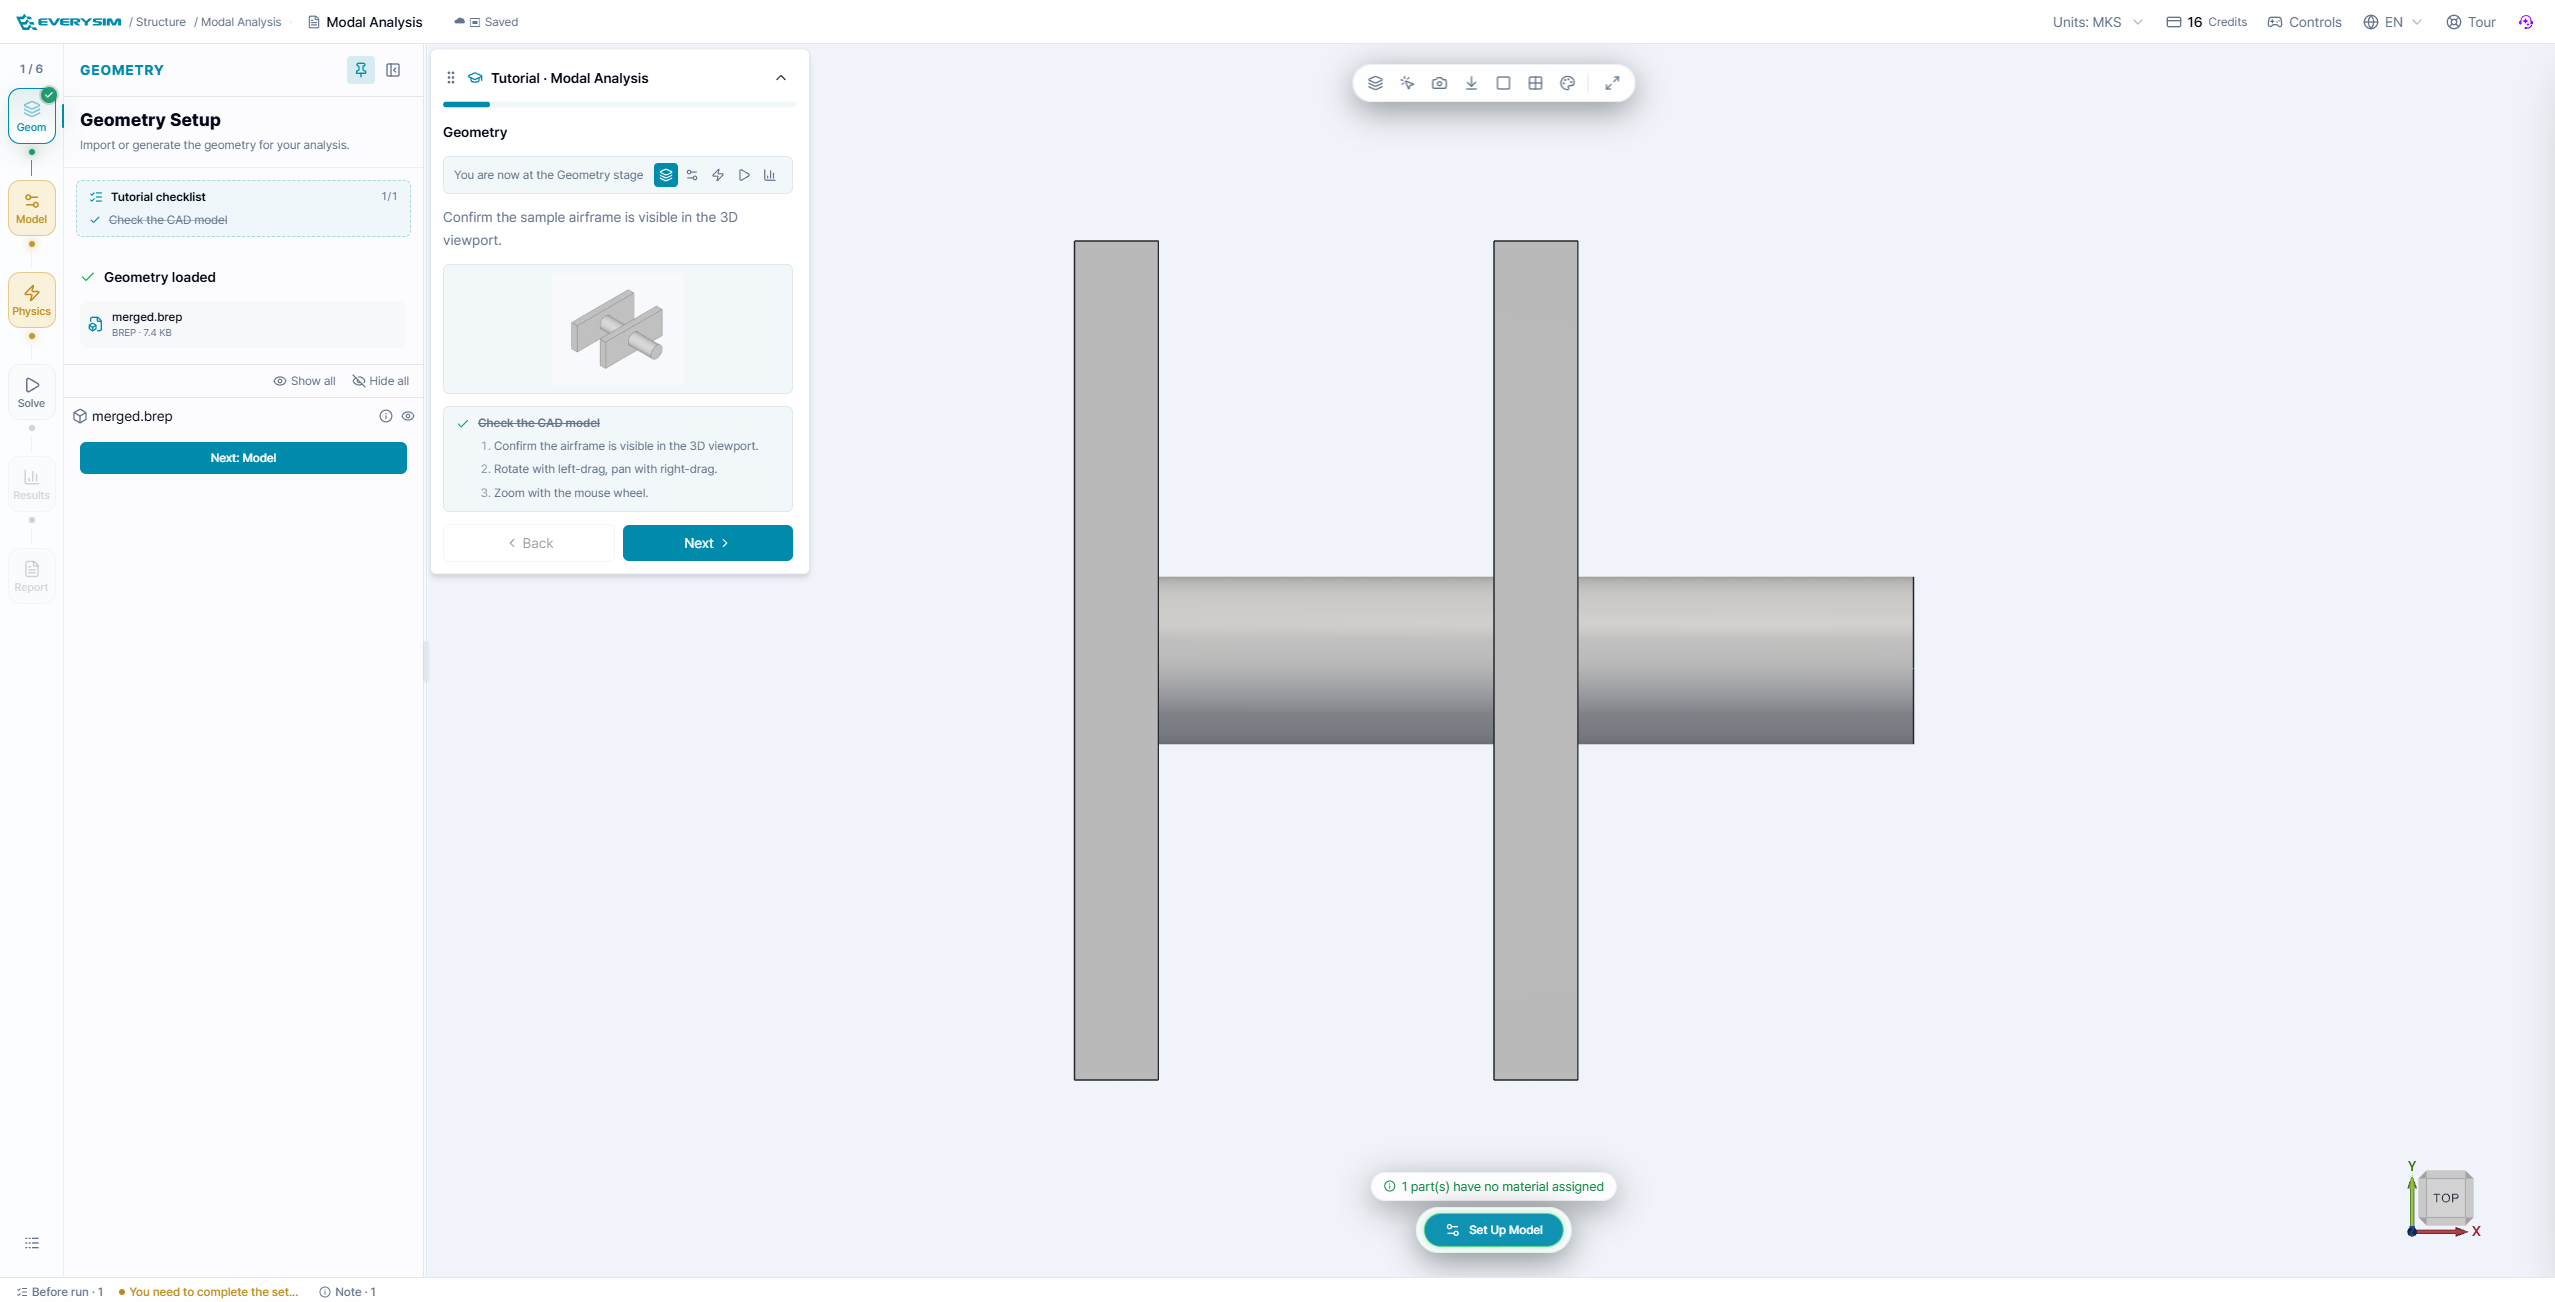
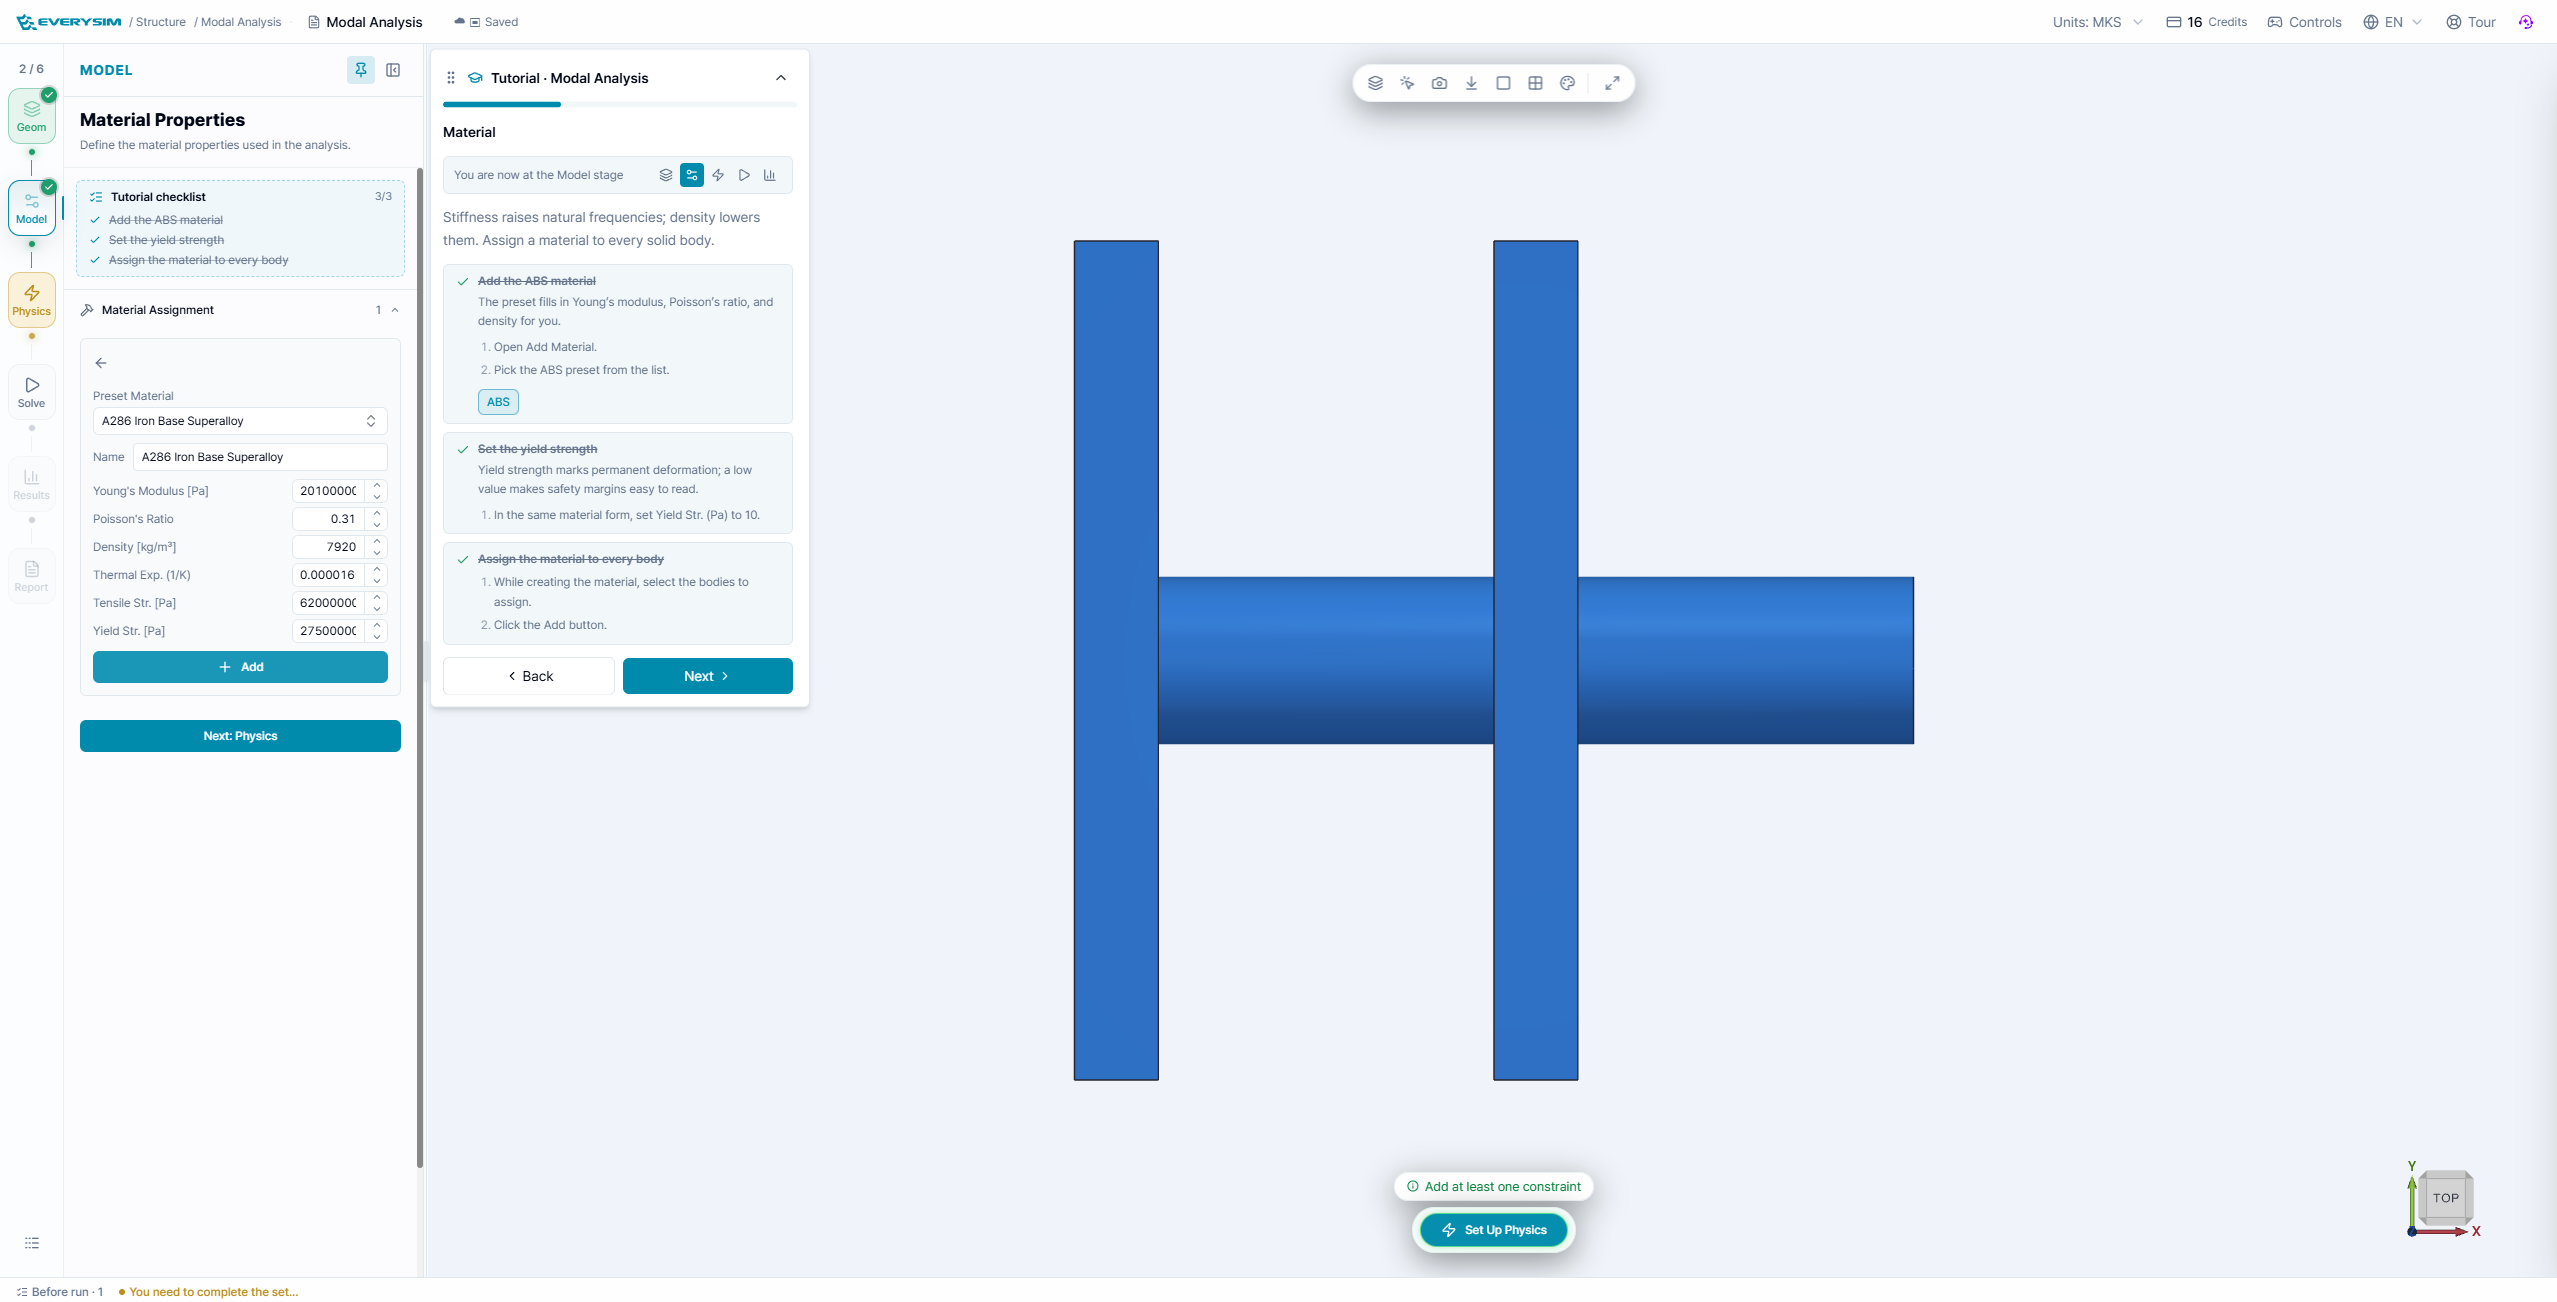
Confirm that the sample bracket/shaft assembly is loaded and oriented correctly. Assign the tutorial material to all bodies. Modal results depend on both stiffness and mass, so do not omit density even when the model appears rigid.
2. Fixed support
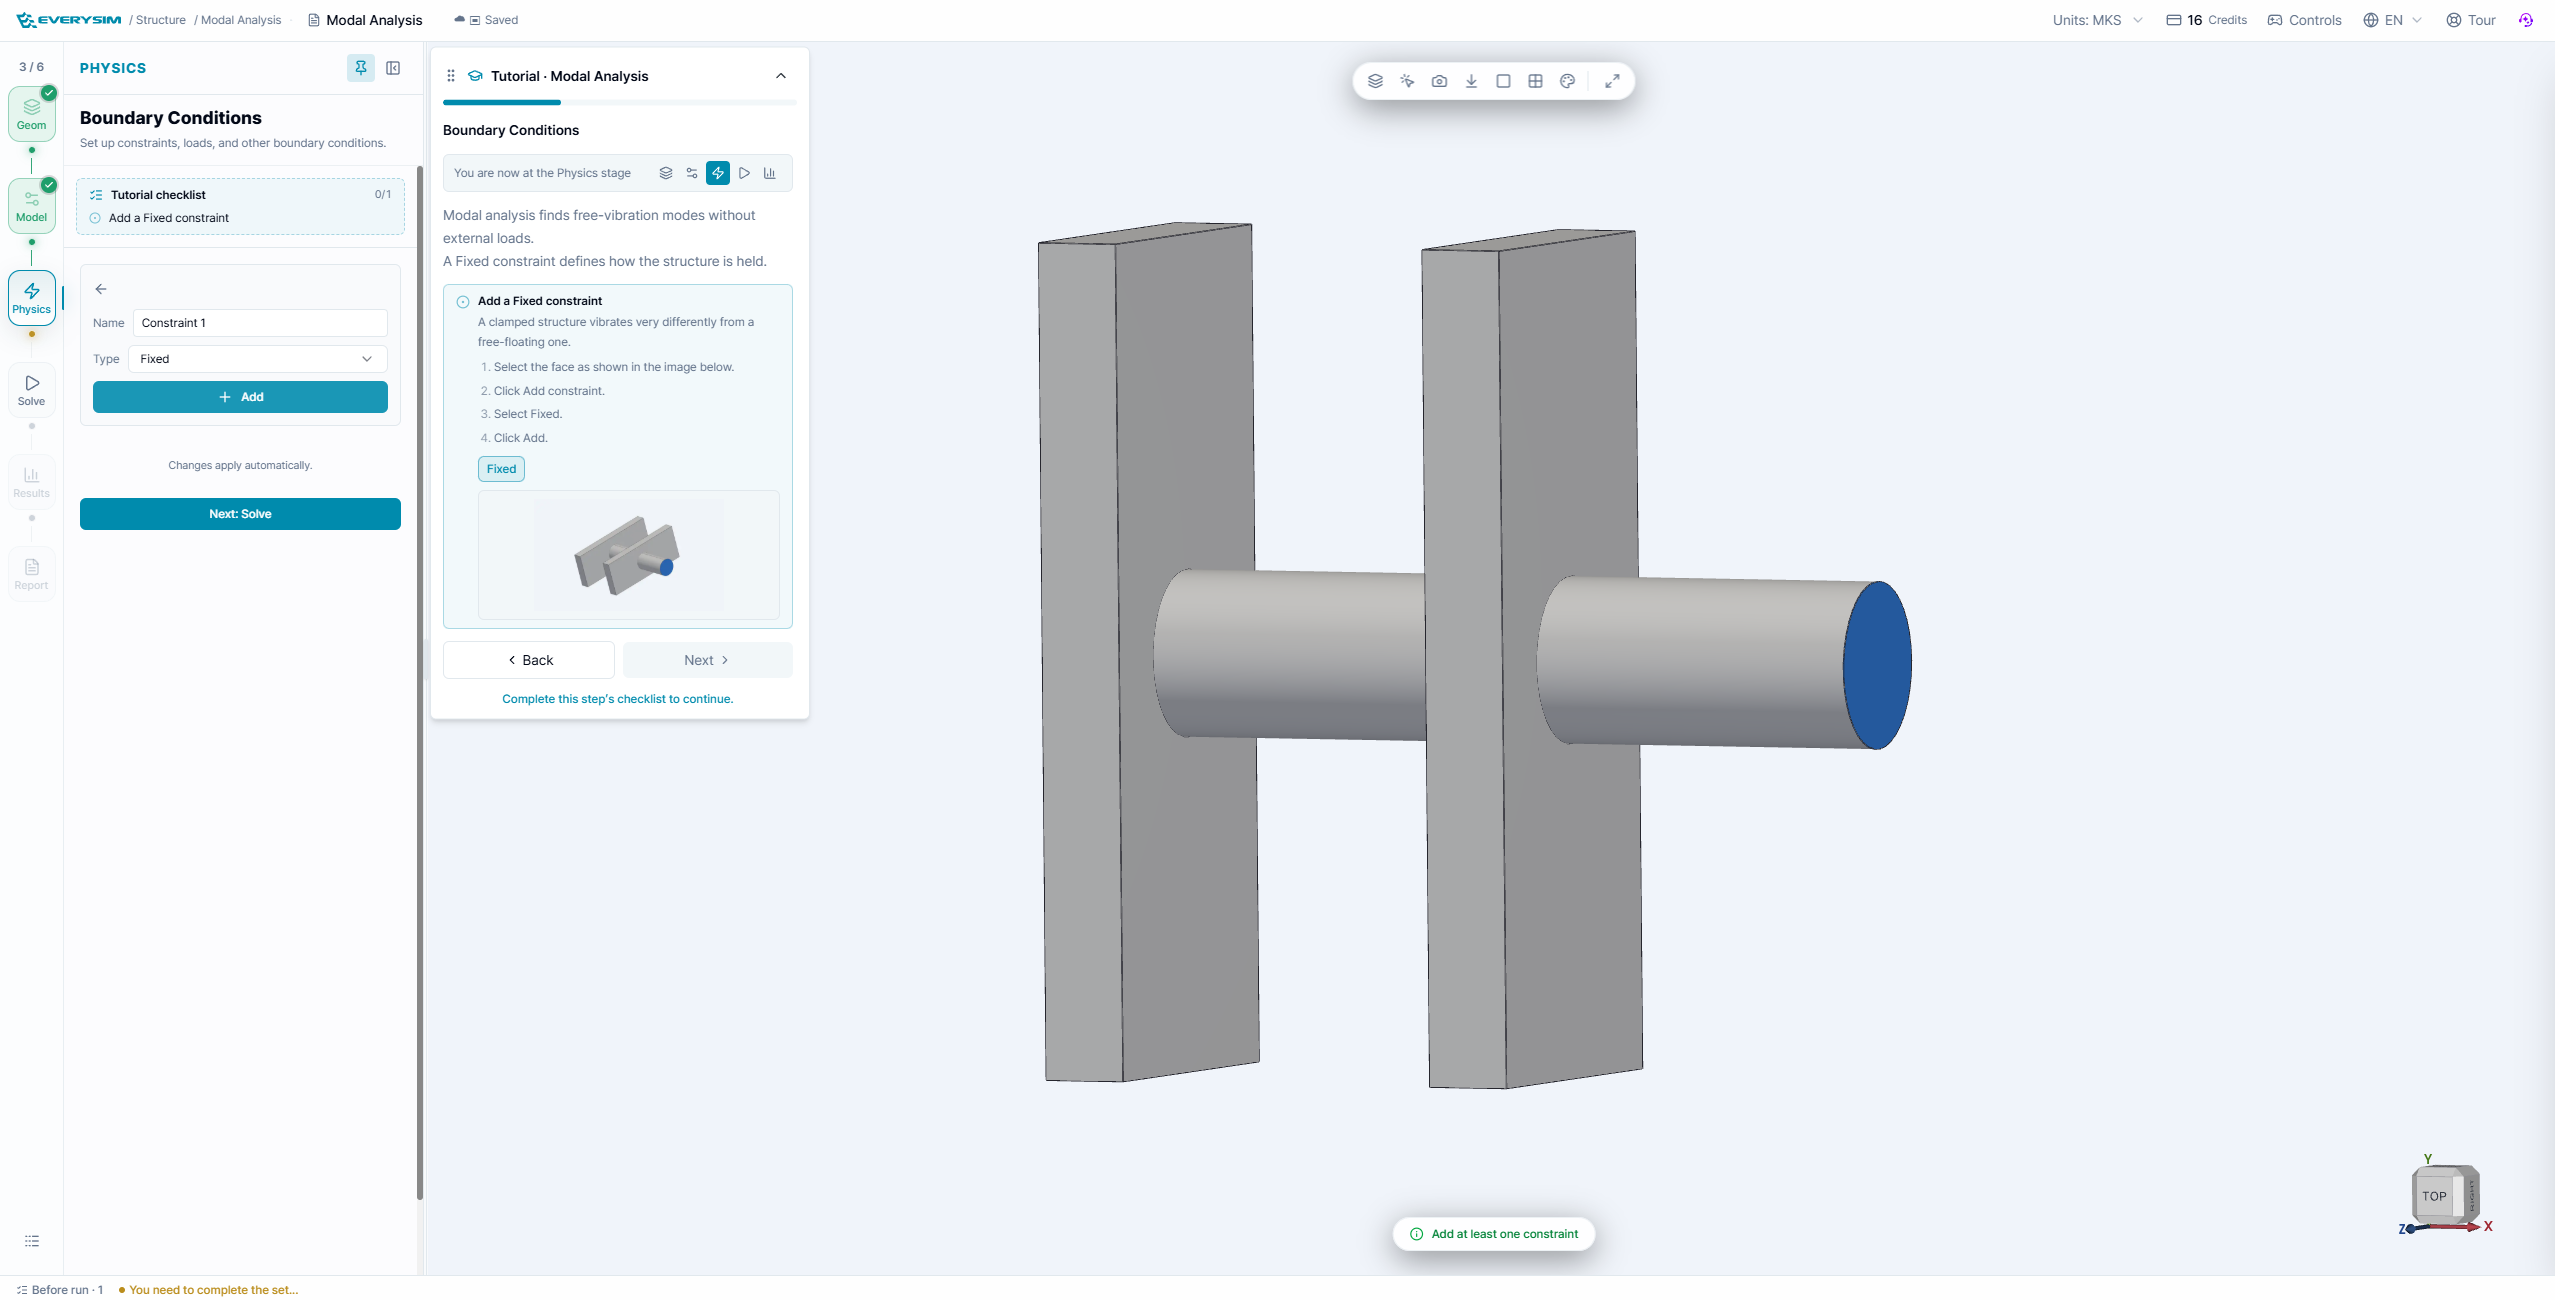
Add the Fixed constraint to the tutorial face. The support defines how the component is attached in the real drone. Removing a rigid-body degree of freedom raises the lowest frequencies; adding a support that does not exist physically can make the result unrealistically stiff.
3. Solve for modes
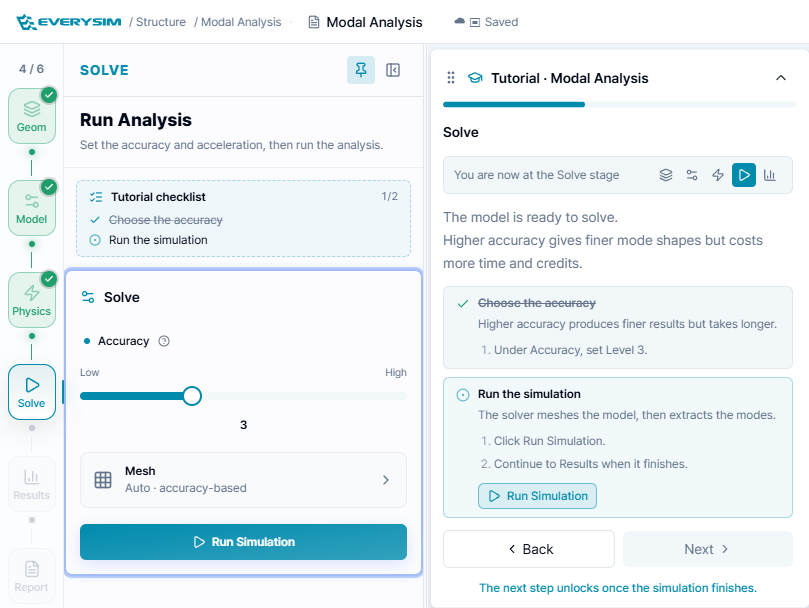
Set the tutorial accuracy to 3 and click Run Simulation. The solver generates the mesh and extracts the requested mode set. Wait until the run card reports success before comparing frequencies.
4. Inspect mode shapes
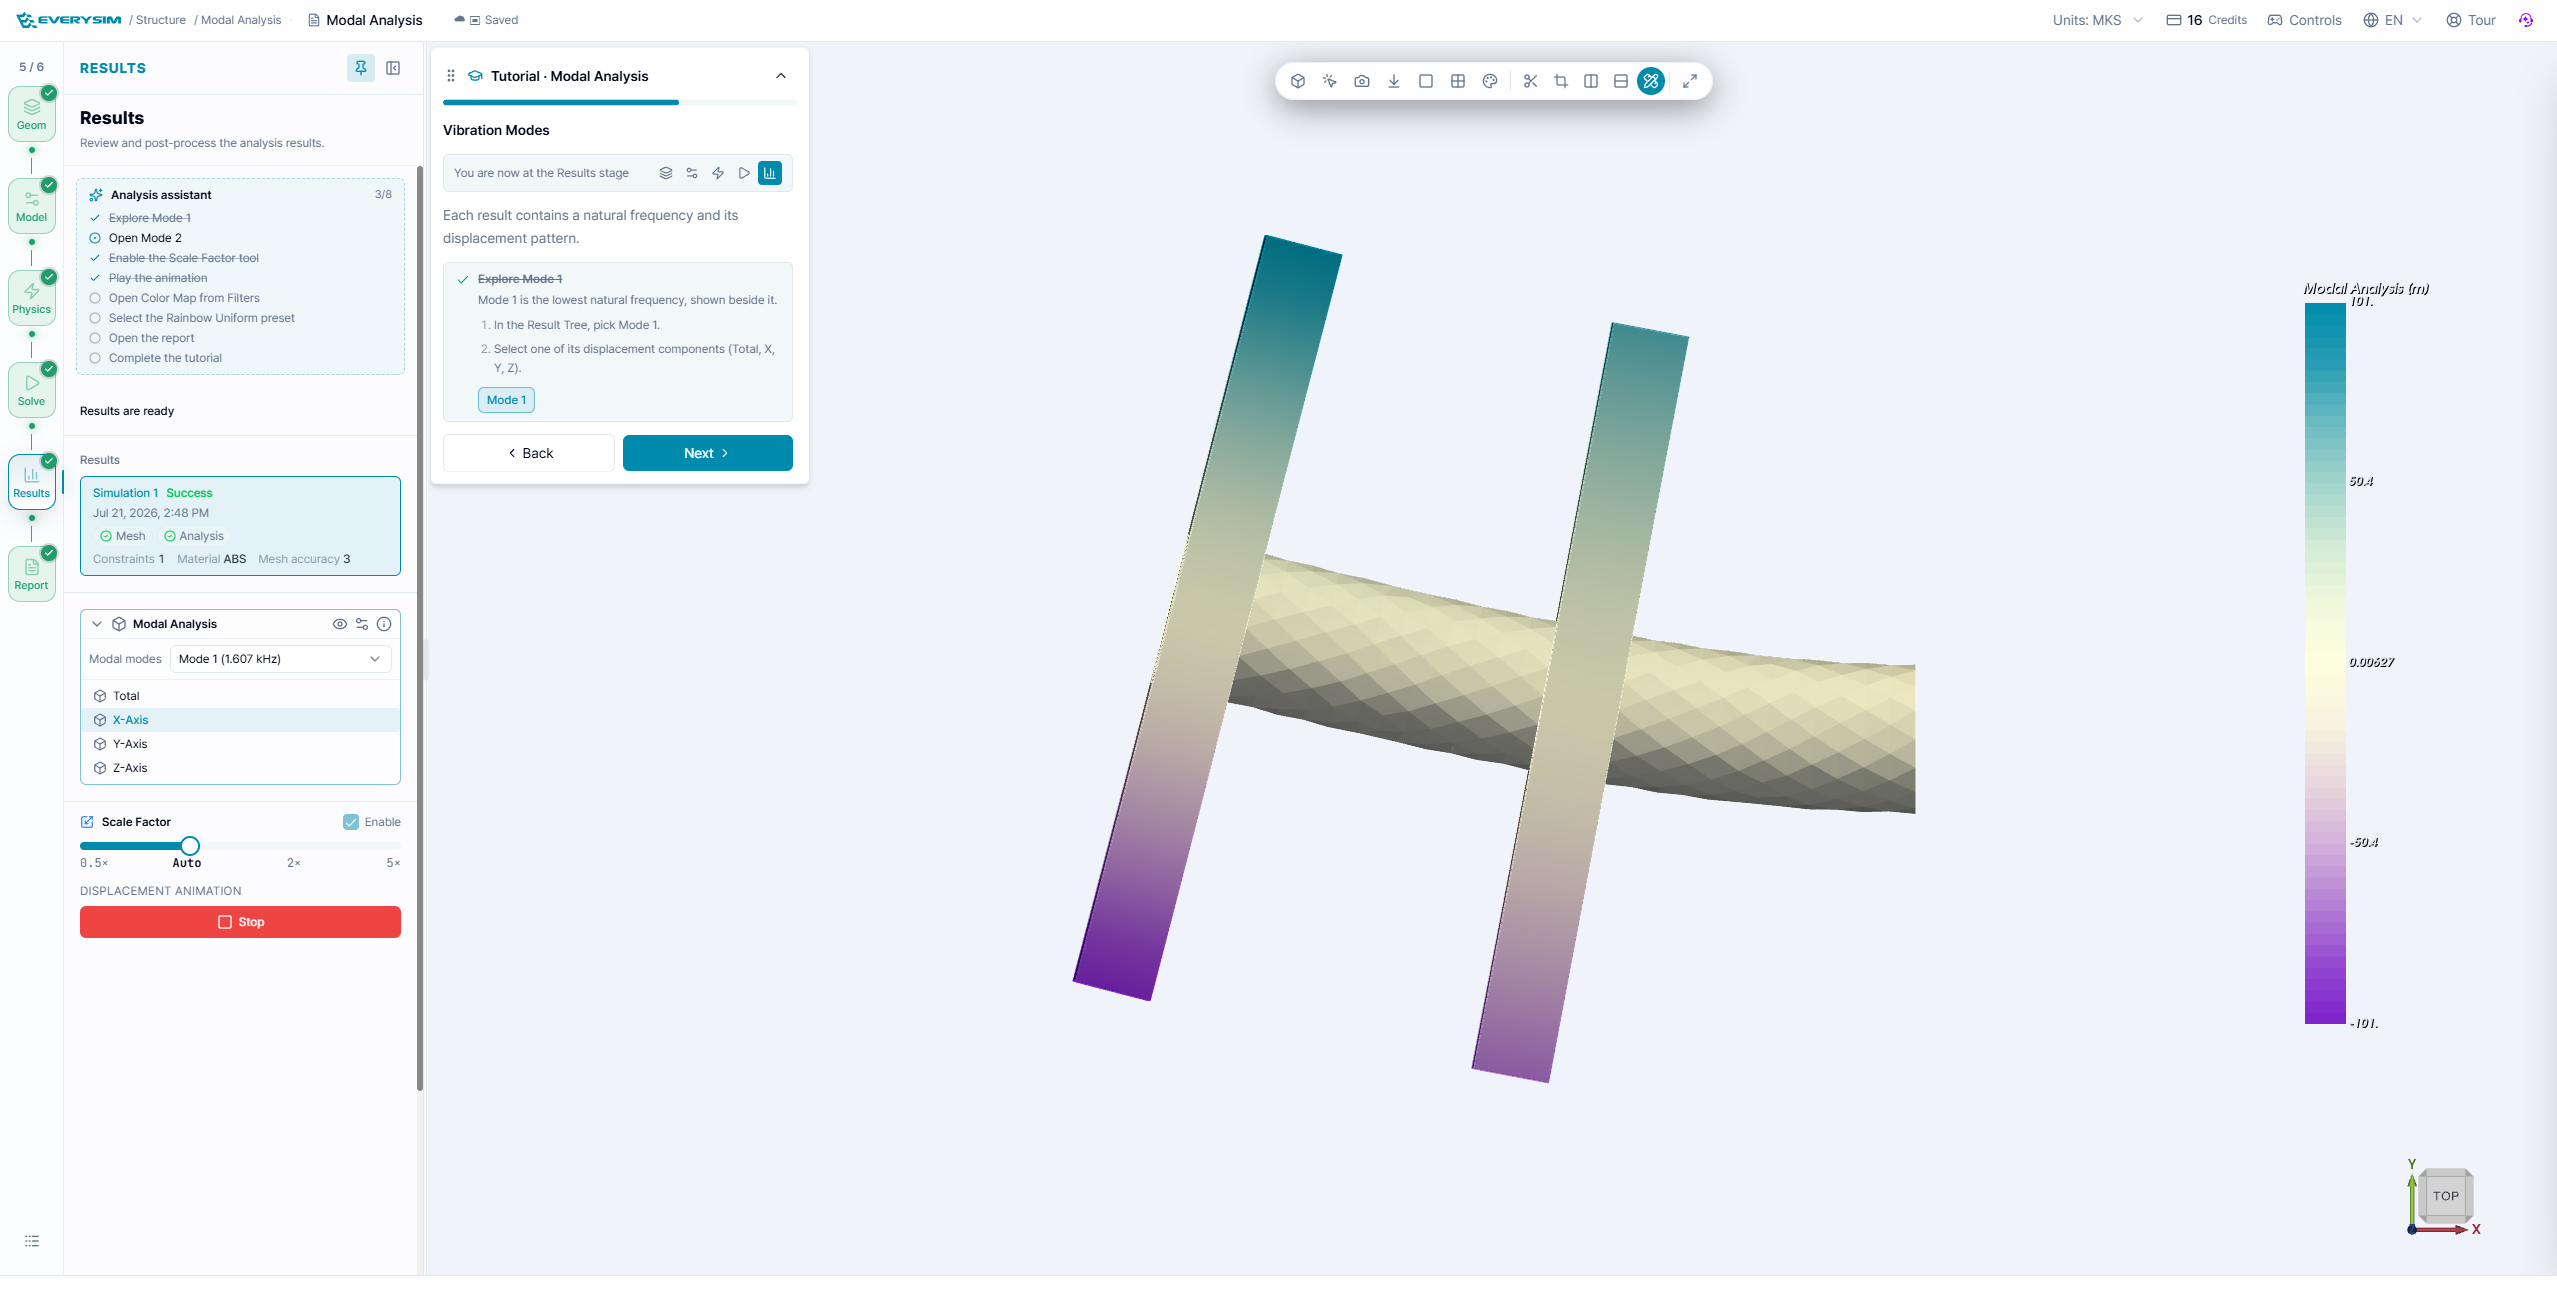
In Results, select a mode and press Play. The displayed deformation is normally scaled so that a small vibration becomes visible; it is a shape, not the physical amplitude at a particular operating condition.
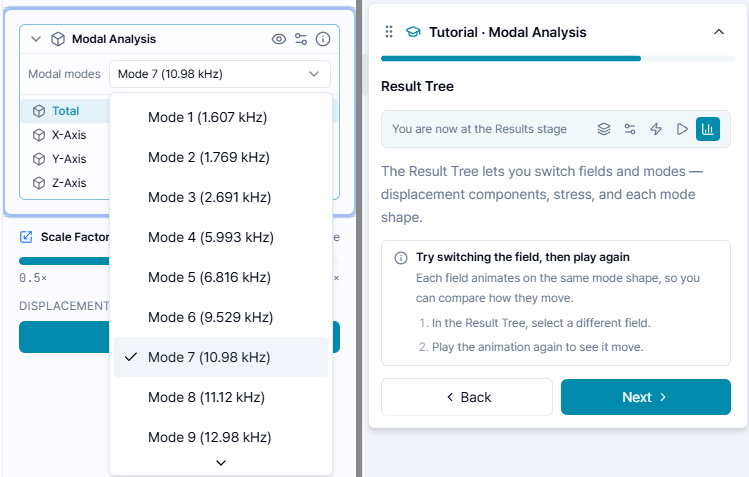
Use the mode selector to move from Mode 1 to higher modes. Record the natural frequency and look for nodal lines, bending, torsion, or coupled motion. A mode with a frequency near a motor order or propeller excitation deserves additional dynamic review.
5. Color map and direction
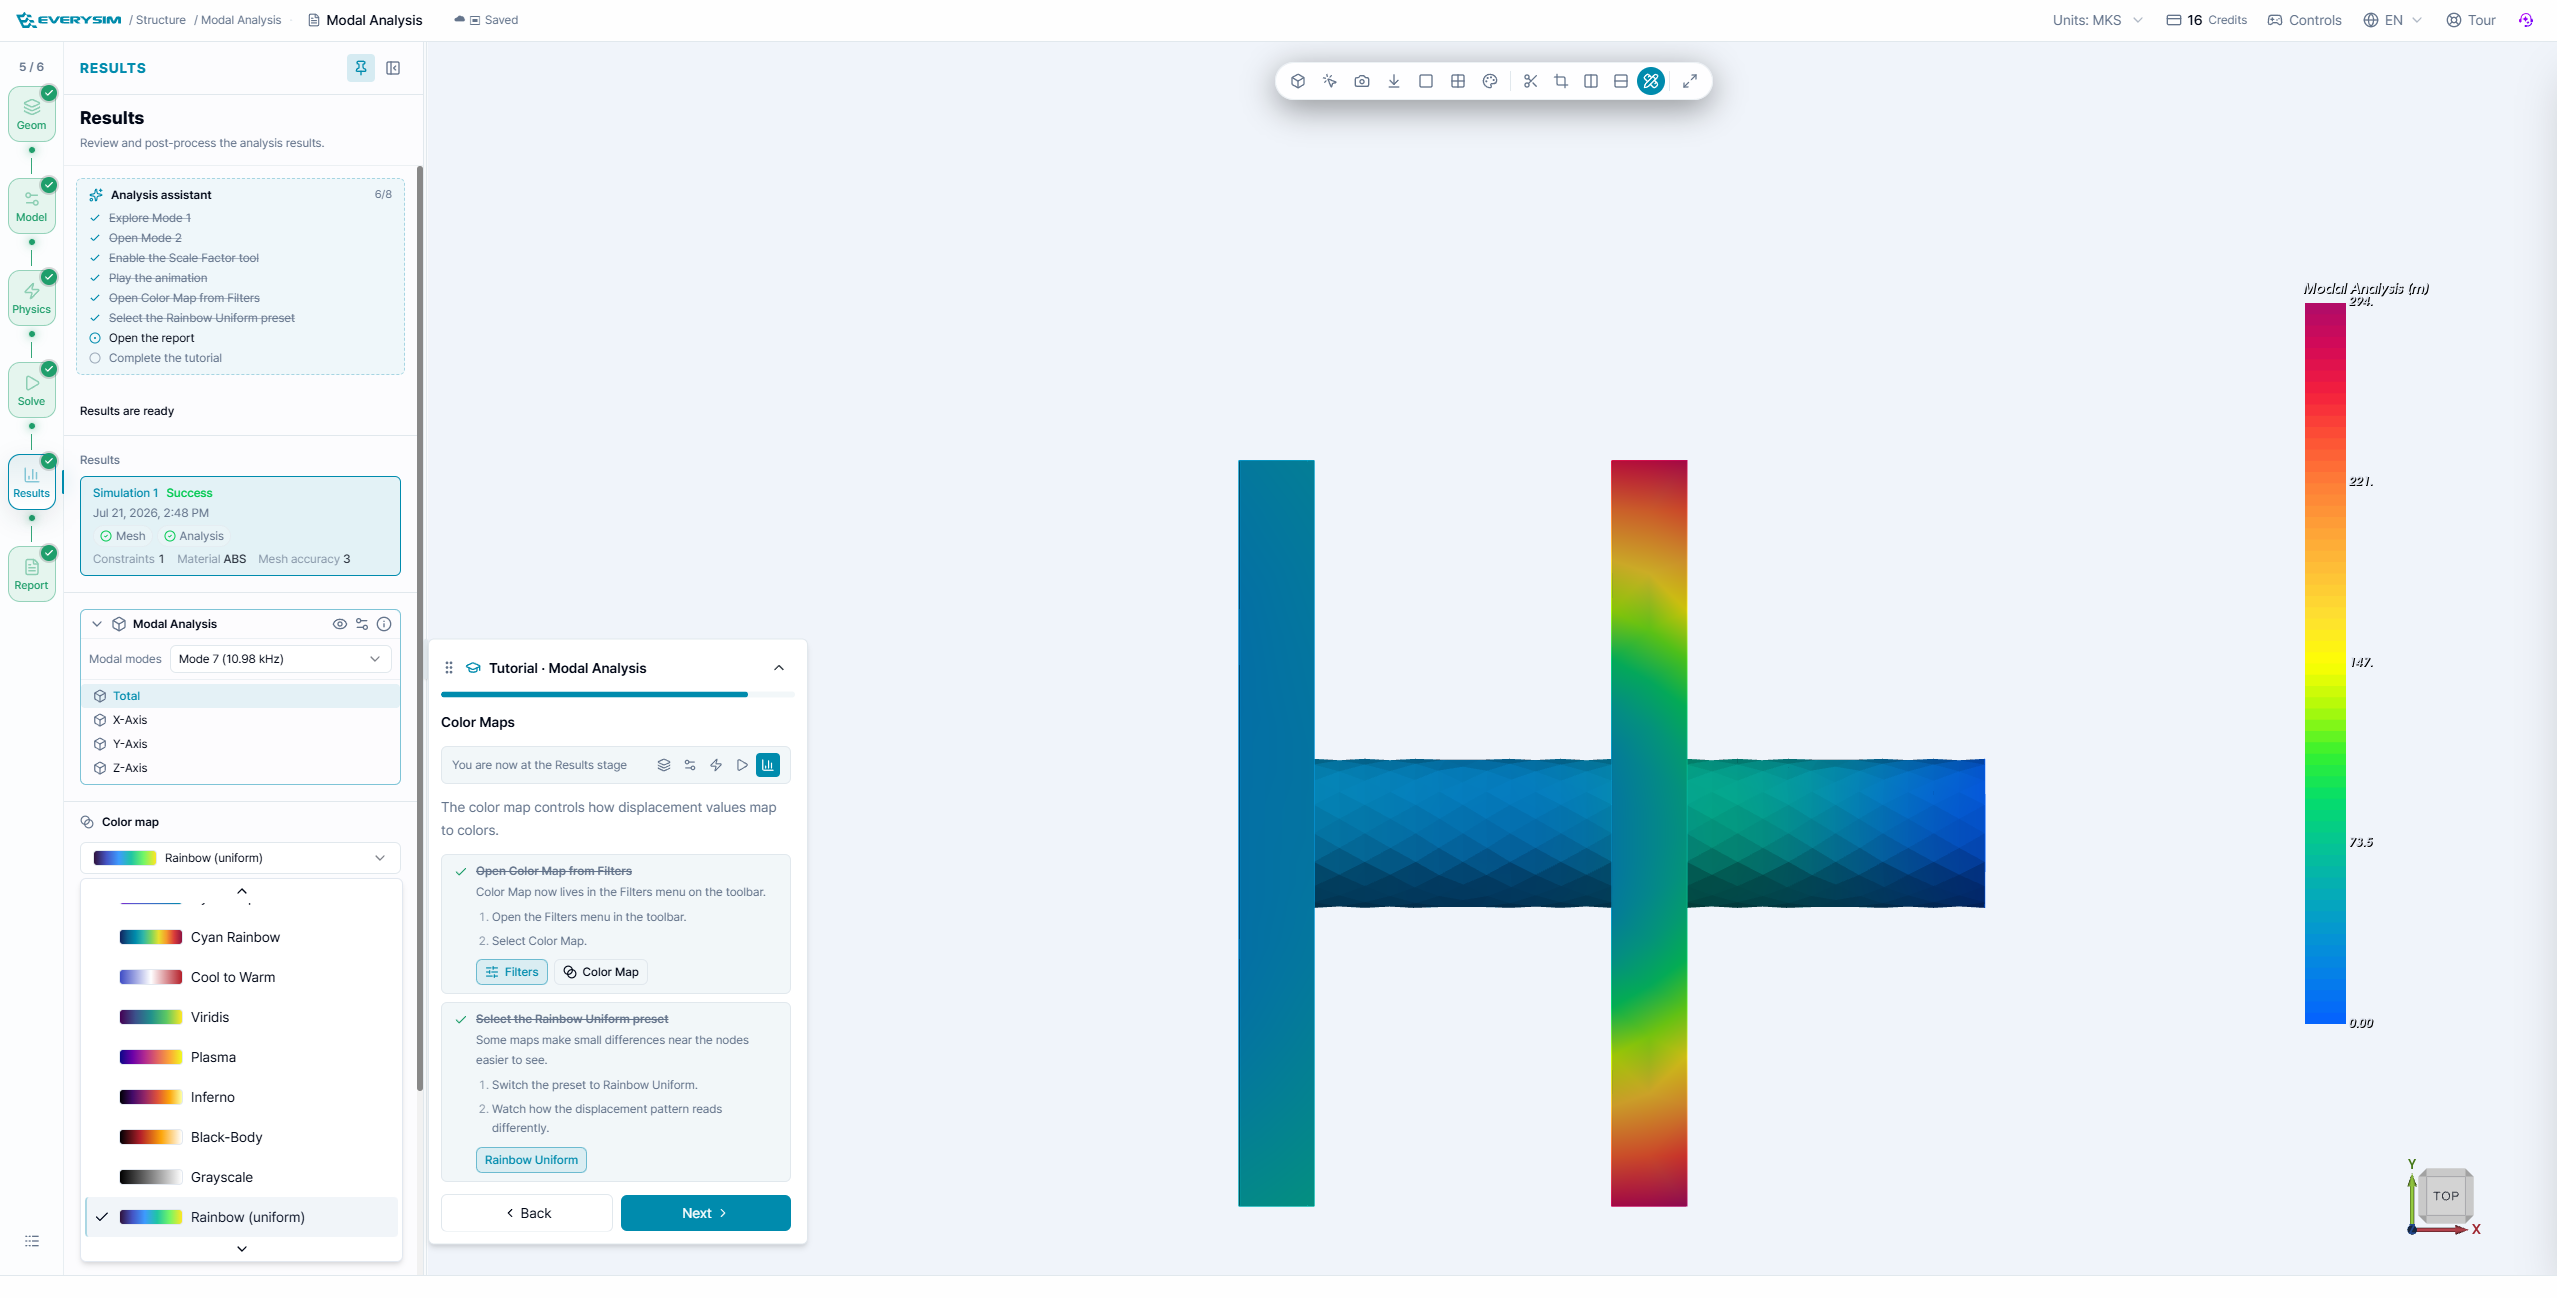
Use Filters → Color Map to make the relative deformation readable. Switch between Total, X, Y, and Z components when the direction of motion matters. The total component is best for finding the overall shape; directional components help distinguish bending from torsion.
6. Report
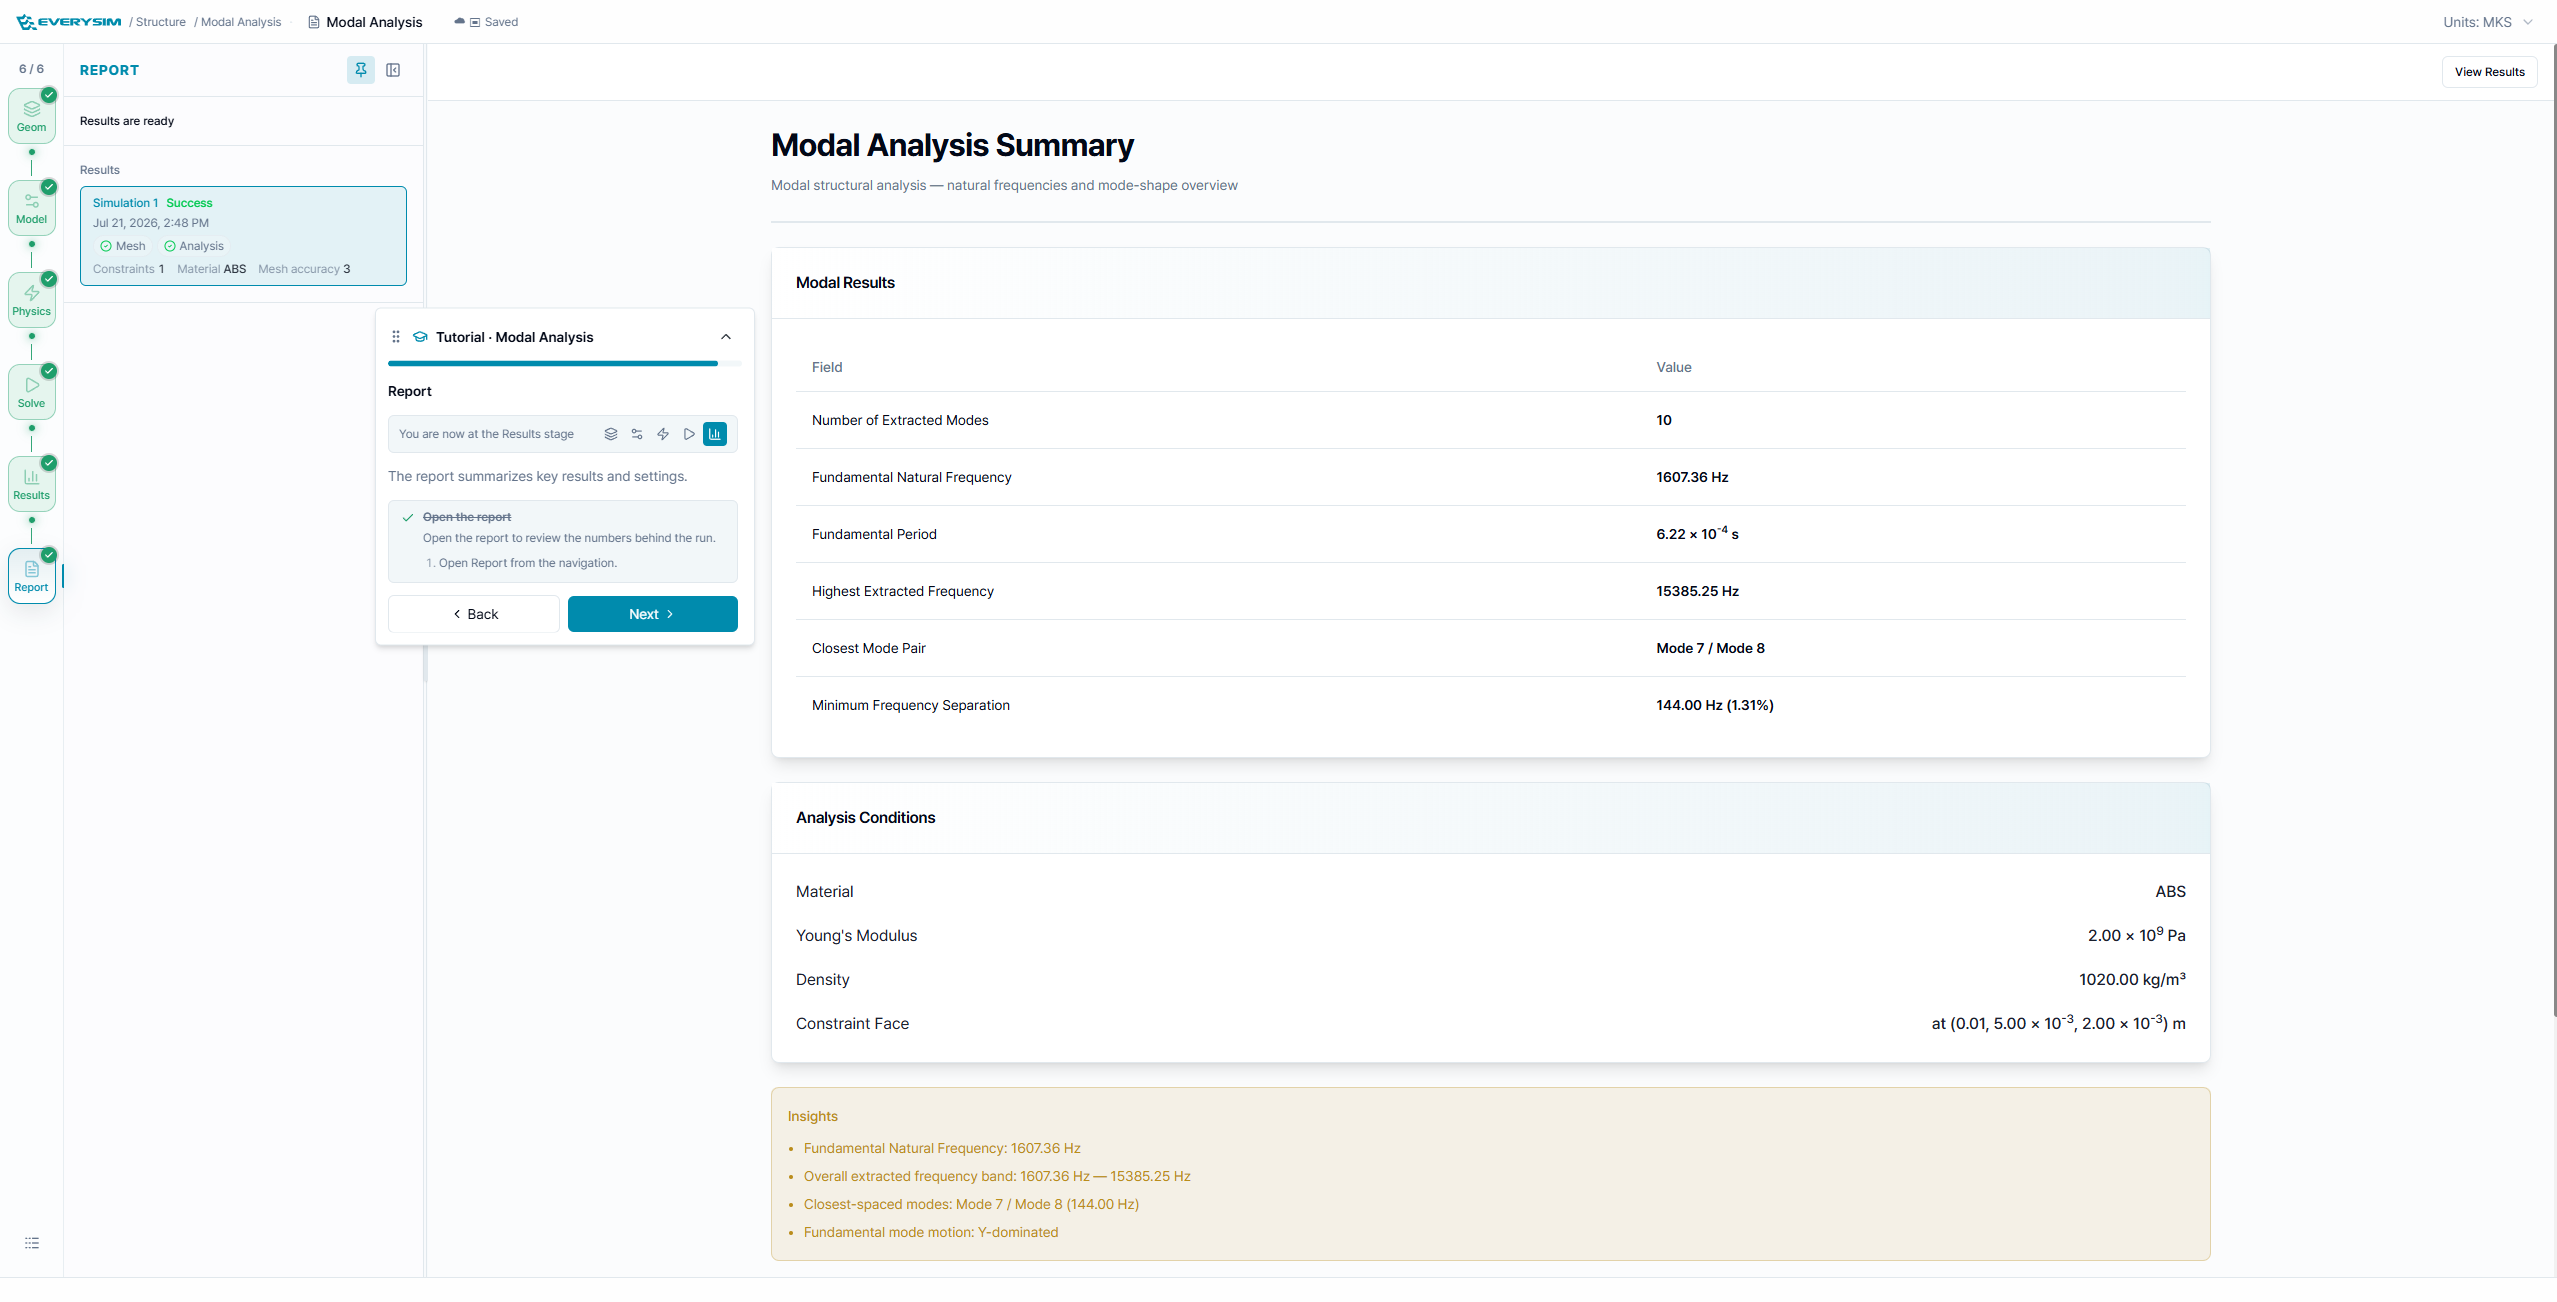
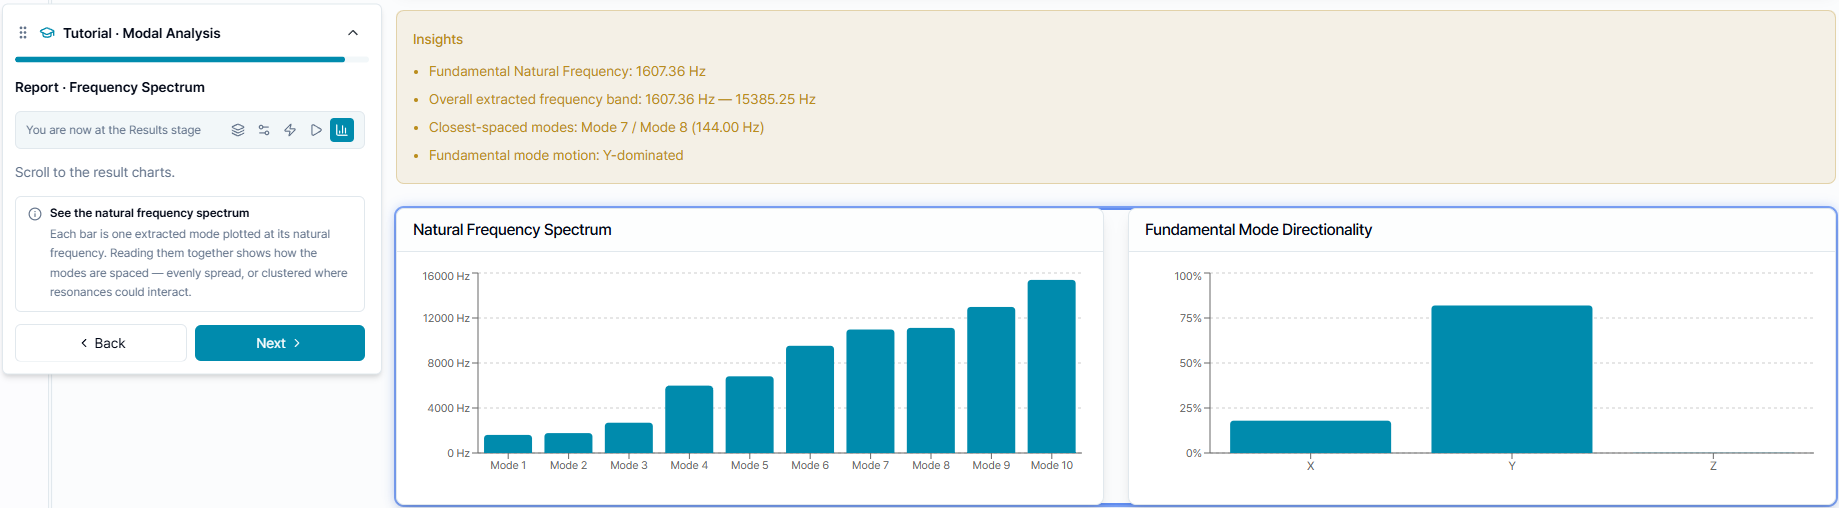
The report lists extracted mode numbers, natural frequencies, directional content, and the nearest-mode spacing. Use it to:
- compare the first several modes against expected excitation frequencies;
- identify repeated or closely spaced modes that may be sensitive to small design changes;
- check that the selected support and material are the intended physical assumptions.
The screenshot set ends with the completed-tutorial panel; use it as confirmation that the result checklist has been reviewed, not as a substitute for the frequency table.
Interpretation notes
- Modal analysis uses no applied operating load in this tutorial.
- Frequencies change with material stiffness, density, joint assumptions, and constraints.
- A mode shape is normalized and may be visually exaggerated.
- A frequency separation is not a full resonance margin; include motor order, RPM range, damping, and transient loads in a follow-up study.