Fixed Wing: Flow Analysis
Target Aircraft Information
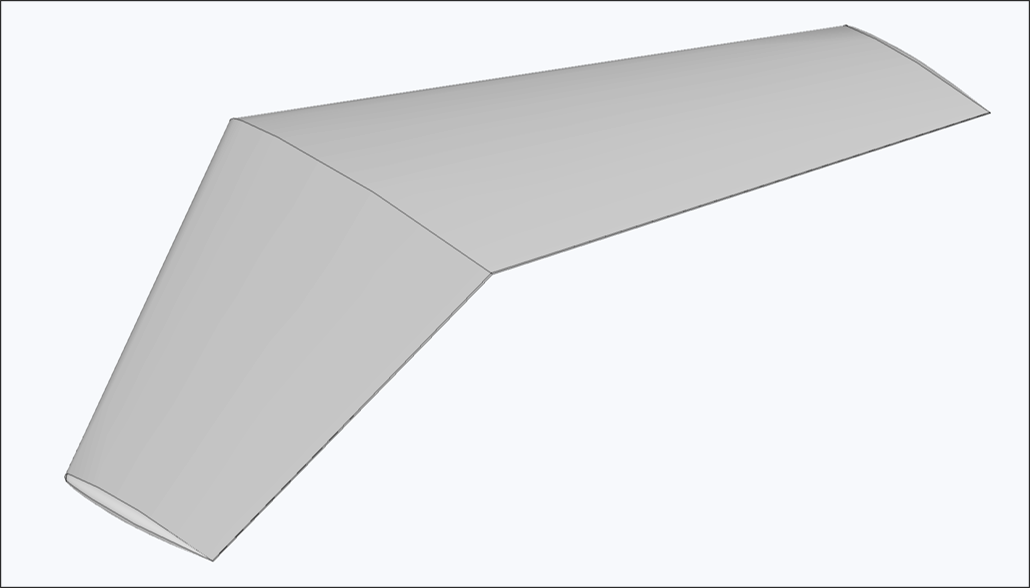
- Name: ONERA-M6 Wing
- Wing span: 0.212[m]
- Reference area (main wing area): 0.8878[m^2]
- Reference length (mean aerodynamic chord, MAC): 0.6397[m]
Download Sample STEP File
Download the sample STEP file to follow along with this tutorial:
Step 1: Import CAD Geometry
- Navigate to the Flow Analysis module
- Click the Import CAD button
- Select the
ONERA-M6.stepfile - Verify that the import completed successfully
Important Notes
- Geometry is directly reflected in the analysis without modification
- Ensure proper scale and units before importing
Step 2: Configure Flow Domain
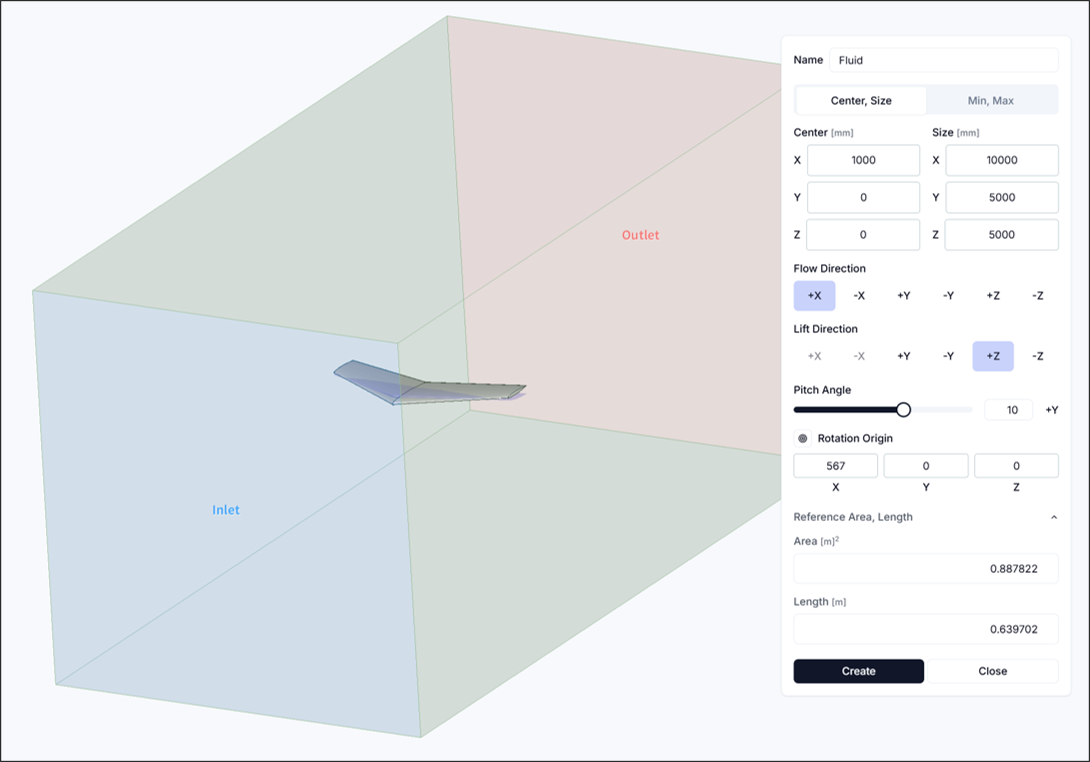
Set up sufficient flow space to properly capture flow characteristics.
- Flow Domain Center:
<1000, 0, 0> - Flow Domain Size:
<10000, 5000, 5000> - Pitch Angle: 10[DEG]
- Reference Area and Length: Configure as follows
- Reference Area: 0.8878[m^2]
- Reference Length: 0.6397[m]
Step 3: Configure Simulation Settings and Run
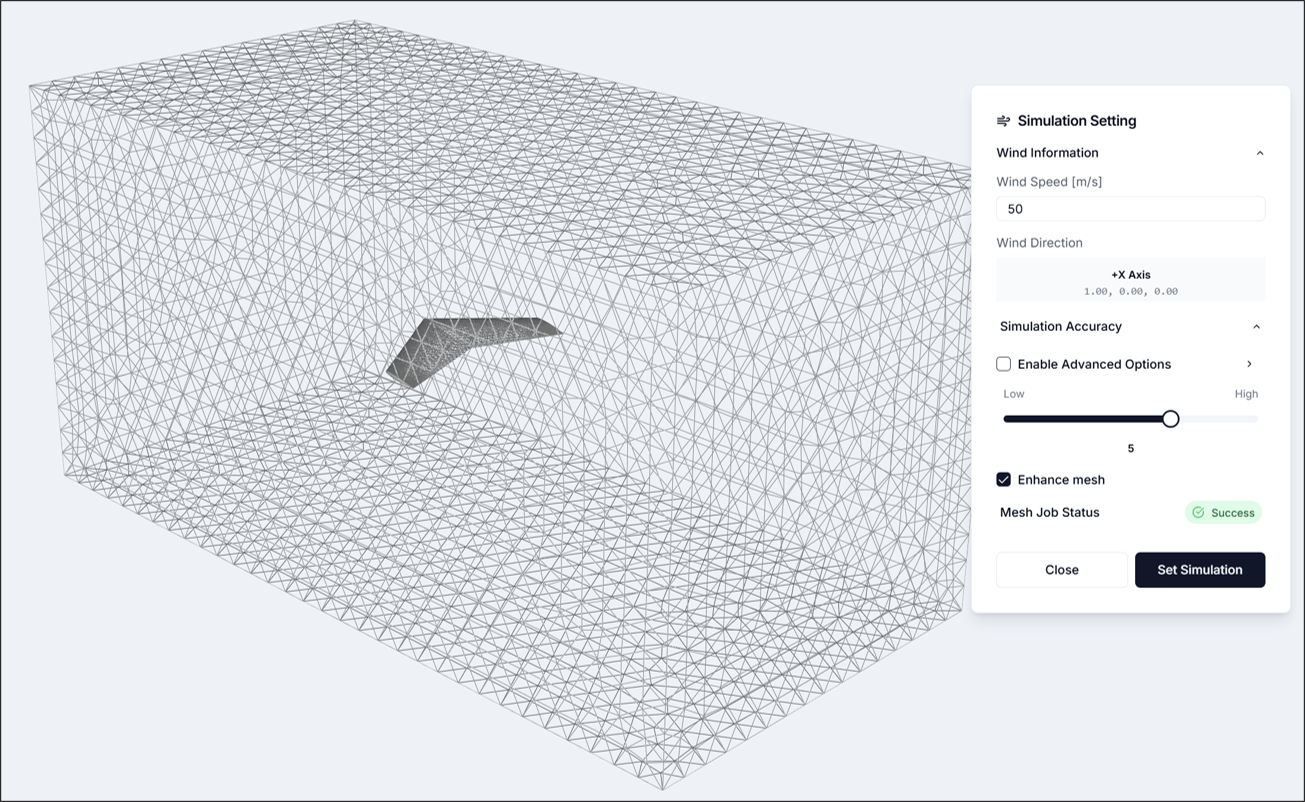
3.1. Simulation Settings
- Flow Velocity: 50[m/s]
- Simulation Accuracy: 5
- Other settings: Use defaults
After configuring simulation settings, verify that the mesh has been generated as shown in the figure.
Step 4: Run Analysis
Set the number of cores freely and run the analysis. For the given CAD, it is recommended to use 8 or more cores.
If the analysis runs successfully, residuals information will appear.
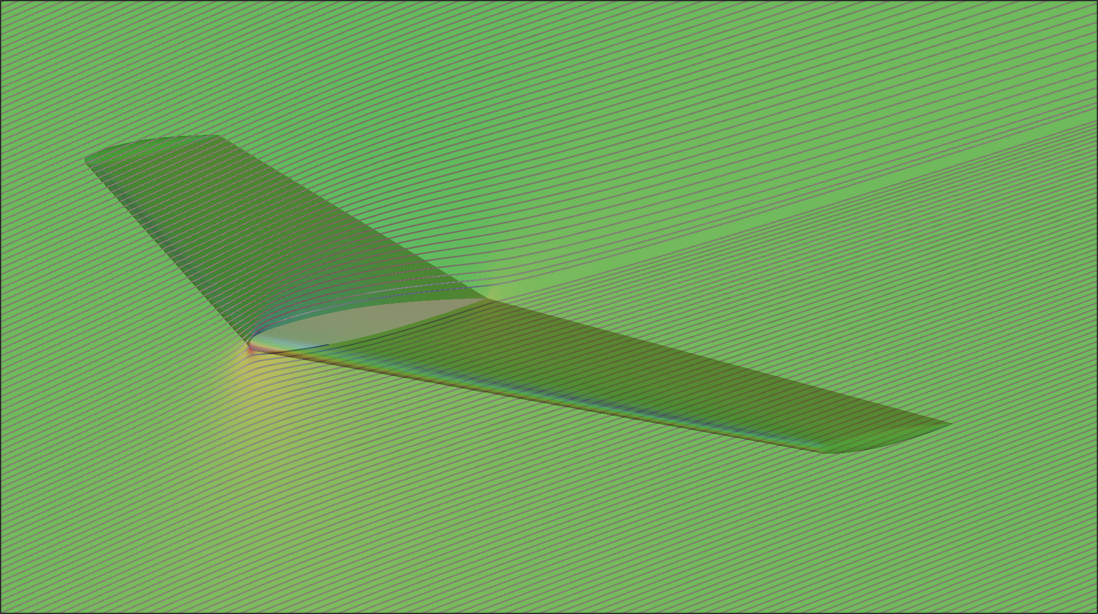
Step 5: Visualize Results
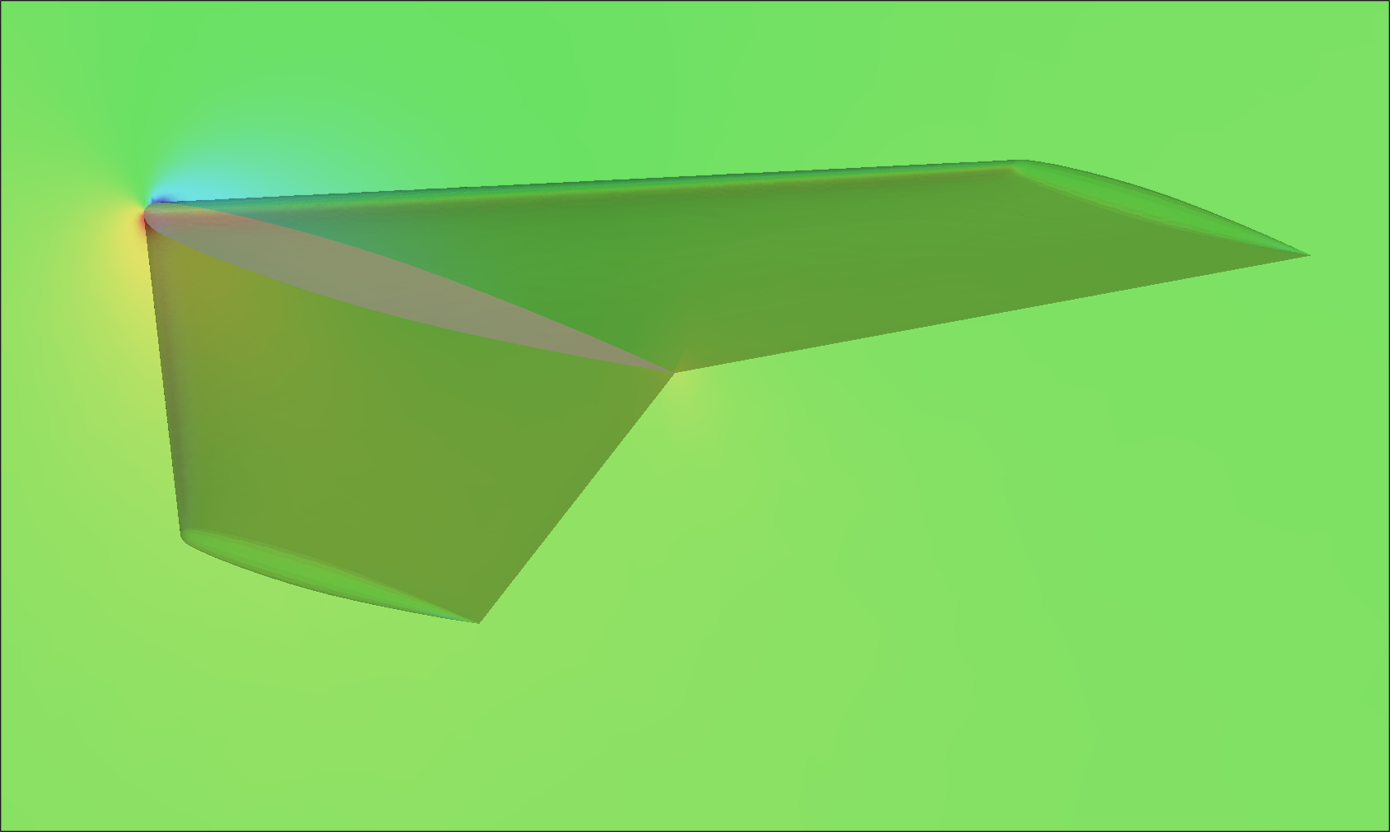
Result visualization is primarily used to review whether the flow analysis results are physically reasonable. In this analysis, we mainly examine the following phenomena:
- Wing tip vortex generation
- Wake formation behind the geometry
- Stagnation point occurrence
- Pressure distribution on the aircraft
Step 6: Review Reports
6.1. Aerodynamic Performance Analysis: Key Performance Indicators and Analysis Conditions
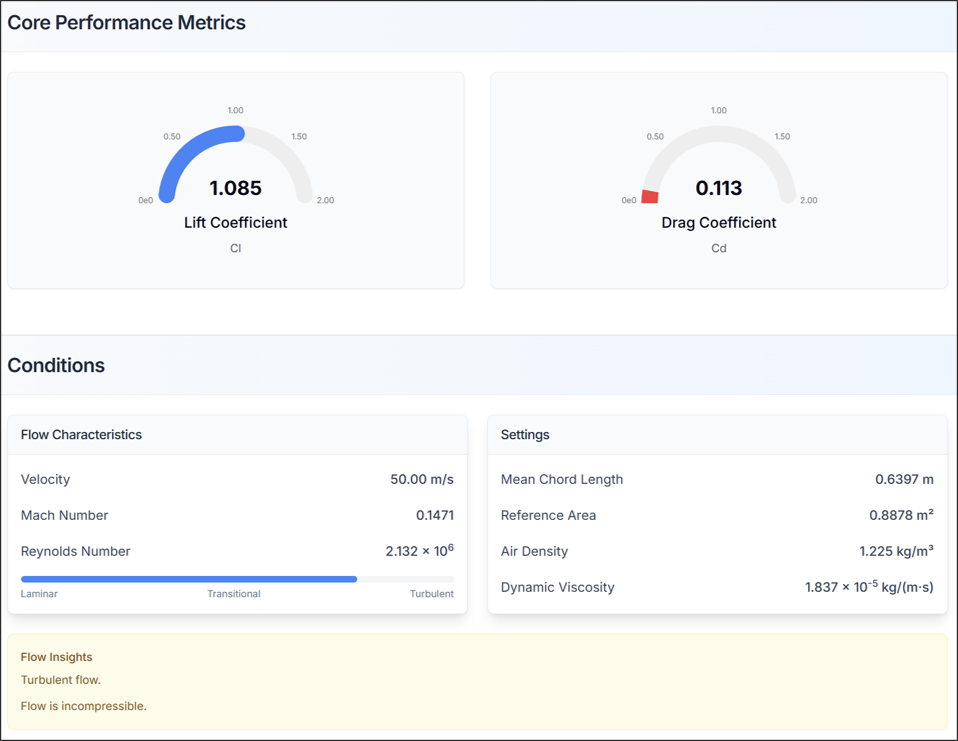
- Check lift coefficient (CL) and drag coefficient (CD)
- Verify that flow characteristics and simulation settings match the configured information
6.2. Aerodynamic Performance Analysis: System Forces and Moments
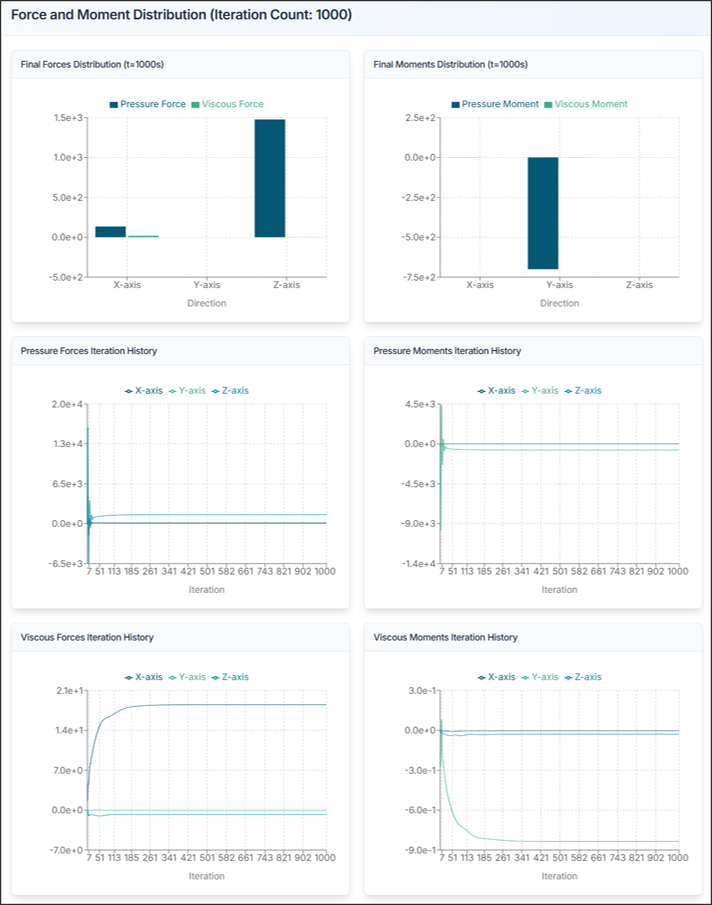
Review the forces acting on the entire aircraft.
- Fx, Fy, Fz: Forces in x, y, z directions [N]
- Mx, My, Mz: Moments about x, y, z axes [N·m]
Design Insights:
- Verify lift coefficient (CL) is within appropriate range
- Minimize drag coefficient (CD) for efficient design
- Check stability of pitching moment (My)
- Review whether wing tip vortex is not excessive
Aircraft Design Tips and Troubleshooting
1) If Lift is Insufficient
- Increase angle of attack
- Increase wing area
- Select high-lift airfoil
- Consider adding flaps or slats
2) If Drag is Excessive
- Optimize wing shape
- Design streamlined fuselage
- Reduce surface roughness
- Reduce induced drag with winglets
3) If Aircraft Stability is Problematic
- Adjust center of gravity (CG) position
- Adjust horizontal/vertical tail size
- Review wing position
- Adjust dihedral angle
4) CAD Import Failure
- Solution: Verify STEP file format is correct, check file size and complexity
5) Analysis Takes Too Long
- Solution: Optimize flow domain size, adjust mesh resolution, increase number of cores
6) Results Appear Unrealistic
- Solution: Check Reynolds number, review boundary conditions
7) Convergence Issues
- Solution: Adjust mesh resolution
Need Assistance or Have Questions?
Frequently Asked Questions: FAQ Link
Support Inquiries: support@everysim.io